Categories
Misc

libcu++ Open-Source GPU-enable C++ Standard Library Updated

libcu++, the NVIDIA C++ Standard Library, provides a C++ Standard Library for your entire system which can be used in and between CPU and GPU codes.

libcu++, the NVIDIA C++ Standard Library, provides a C++ Standard Library for your entire system which can be used in and between CPU and GPU codes. The NVIDIA C++ Standard Library is an open source project. 

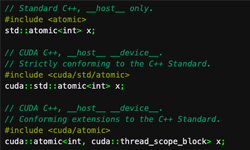
Version 1.4.0 of libcu++ is a major release providing several feature enhancements and bug fixes. It adds support for the following: , NVCC + MSVC support for , and backports of C++20 and C++17 features to C++14.

Other enhancements include improved and reorganized documentation, atomics decoupled from host Standard Library in MSVC, and revamped examples and benchmarks.  

Additional information, examples and documentation can be found below.

libcu++ is available on GitHub and is included in the NVIDIA HPC SDK and the CUDA Toolkit

Learn more:

Categories
Misc

Nsight Compute 2020.3 Simplifies CUDA Kernel Profiling and Optimization

The 2020.3 release of NVIDIA Nsight Compute included in CUDA Toolkit 11.2 introduces several new features that simplify the process of CUDA kernel profiling and optimization.

The 2020.3 release of NVIDIA Nsight Compute included in CUDA Toolkit 11.2 introduces several new features that simplify the process of CUDA kernel profiling and optimization.

Profile Series

The new Profile Series feature allows developers to configure ranges for multiple kernel parameters. Nsight Compute will automatically iterate through the ranges and profile each combination to help you find the best configuration. These parameters include the number of registers per thread, shared memory sizes, and the shared memory configuration. This automates a process that previously would need manual support, and can provide optimized performance configurations with minimal changes to source code.

The Profile Series configuration is available in the UI’s Interactive Profiling activity.

Import Source

This highly requested feature enables users to archive source files within their Nsight Compute results. It allows any user with access to the results to resolve performance data to lines in the source code, even if they don’t have access to the original source files. Sharing results with teammates and archiving them for future analysis are just a couple of uses for this new feature. Users can import source files with the (–import-source) command-line option or via the UI when configuring the profile. 

Source Files can also be imported later via the Profile Menu.

Additionally, there are several other new capabilities available in this release. These include Memory Allocation Tracking, support for derived metrics, and additional configurations and advice for the recently released Application Replay feature.

For complete details, check out the Nsight Compute Release Notes.

Download Nsight Compute 2020.3 and check out featured spotlight video demonstrations on Roofline Analysis and Application Replay

View all Nsight DevBlogs.

Categories
Misc

CUDA 11.2 Introduces Improved User Experience and Application Performance

CUDA 11.2 includes improved user experience and application performance through a combination of driver/toolkit compatibility enhancements, new memory suballocator feature, and compiler upgrades.

CUDA Toolkit is a complete, fully-featured software development platform for building GPU-accelerated applications, providing all the components needed to develop apps targeting every NVIDIA GPU platform. 

CUDA 11 announced support for the new NVIDIA A100 based on the NVIDIA Ampere architecture, and CUDA 11.1 delivered support for NVIDIA GeForce RTX 30 Series and Quadro RTX Series GPU platforms. 

Today, CUDA 11.2 is introducing improved user experience and application performance through a combination of driver/toolkit compatibility enhancements, new memory suballocator feature, and compiler enhancements including an LLVM upgrade. 

This new 11.2 release also delivers programming model updates to CUDA Graphs and Cooperative Groups, as well as expanding support for latest generation operating systems and compilers. 

We describe some of these innovative feature introductions with more detail in a new blog Enhancing Memory Allocation with New NVIDIA CUDA 11.2 Features, and we will publish additional blogs on compiler enhancements shortly. Follow all CUDA Developer Blogs here

Download CUDA 11.2 Toolkit today.

View All CUDA DevBlogs.

Watch [GTC Fall Session] CUDA New Features and Beyond: Ampere Programming for Developers

Categories
Misc

torch 0.2.0 – Initial JIT support and many bug fixes

We are happy to announce that the version 0.2.0 of torch just
landed on CRAN.

This release includes many bug fixes and some nice new features
that we will present in this blog post. You can see the full
changelog in the NEWS.md
file.

The features that we will discuss in detail are:

  • Initial support for JIT tracing
  • Multi-worker dataloaders
  • Print methods for nn_modules

Multi-worker dataloaders

dataloaders now respond to the num_workers argument and will run
the pre-processing in parallel workers.

For example, say we have the following dummy dataset that does a
long computation:

library(torch) dat <- dataset( "mydataset", initialize = function(time, len = 10) { self$time <- time self$len <- len }, .getitem = function(i) { Sys.sleep(self$time) torch_randn(1) }, .length = function() { self$len } ) ds <- dat(1) system.time(ds[1])
 user system elapsed 0.029 0.005 1.027 

We will now create two dataloaders, one that executes
sequentially and another executing in parallel.

seq_dl <- dataloader(ds, batch_size = 5) par_dl <- dataloader(ds, batch_size = 5, num_workers = 2)

We can now compare the time it takes to process two batches
sequentially to the time it takes in parallel:

seq_it <- dataloader_make_iter(seq_dl) par_it <- dataloader_make_iter(par_dl) two_batches <- function(it) { dataloader_next(it) dataloader_next(it) "ok" } system.time(two_batches(seq_it)) system.time(two_batches(par_it))
 user system elapsed 0.098 0.032 10.086 user system elapsed 0.065 0.008 5.134 

Note that it is batches that are obtained in parallel, not
individual observations. Like that, we will be able to support
datasets with variable batch sizes in the future.

Using multiple workers is not necessarily
faster than serial execution because there’s a considerable
overhead when passing tensors from a worker to the main session as
well as when initializing the workers.

This feature is enabled by the powerful callr package and works in all
operating systems supported by torch. callr let’s us create
persistent R sessions, and thus, we only pay once the overhead of
transferring potentially large dataset objects to workers.

In the process of implementing this feature we have made
dataloaders behave like coro iterators. This means that
you can now use coro’s syntax for looping
through the dataloaders:

coro::loop(for(batch in par_dl) { print(batch$shape) })
[1] 5 1 [1] 5 1

This is the first torch release including the multi-worker
dataloaders feature, and you might run into edge cases when using
it. Do let us know if you find any problems.

Initial JIT support

Programs that make use of the torch package are inevitably R
programs and thus, they always need an R installation in order to
execute.

As of version 0.2.0, torch allows users to JIT trace torch R
functions into TorchScript. JIT (Just in time) tracing will invoke
an R function with example inputs, record all operations that
occured when the function was run and return a script_function
object containing the TorchScript representation.

The nice thing about this is that TorchScript programs are
easily serializable, optimizable, and they can be loaded by another
program written in PyTorch or LibTorch without requiring any R
dependency.

Suppose you have the following R function that takes a tensor,
and does a matrix multiplication with a fixed weight matrix and
then adds a bias term:

w <- torch_randn(10, 1) b <- torch_randn(1) fn <- function(x) { a <- torch_mm(x, w) a + b }

This function can be JIT-traced into TorchScript with jit_trace
by passing the function and example inputs:

x <- torch_ones(2, 10) tr_fn <- jit_trace(fn, x) tr_fn(x)
torch_tensor -0.6880 -0.6880 [ CPUFloatType{2,1} ]

Now all torch operations that happened when computing the result
of this function were traced and transformed into a graph:

tr_fn$graph
graph(%0 : Float(2:10, 10:1, requires_grad=0, device=cpu)): %1 : Float(10:1, 1:1, requires_grad=0, device=cpu) = prim::Constant[value=-0.3532 0.6490 -0.9255 0.9452 -1.2844 0.3011 0.4590 -0.2026 -1.2983 1.5800 [ CPUFloatType{10,1} ]]() %2 : Float(2:1, 1:1, requires_grad=0, device=cpu) = aten::mm(%0, %1) %3 : Float(1:1, requires_grad=0, device=cpu) = prim::Constant[value={-0.558343}]() %4 : int = prim::Constant[value=1]() %5 : Float(2:1, 1:1, requires_grad=0, device=cpu) = aten::add(%2, %3, %4) return (%5)

The traced function can be serialized with jit_save:

jit_save(tr_fn, "linear.pt")

It can be reloaded in R with jit_load, but it can also be
reloaded in Python with torch.jit.load:

import torch fn = torch.jit.load("linear.pt") fn(torch.ones(2, 10))
tensor([[-0.6880], [-0.6880]])

How cool is that?!

This is just the initial support for JIT in R. We will continue
developing this. Specifically, in the next version of torch we plan
to support tracing nn_modules directly. Currently, you need to
detach all parameters before tracing them; see an example
here
. This will allow you also to take benefit of TorchScript
to make your models run faster!

Also note that tracing has some limitations, especially when
your code has loops or control flow statements that depend on
tensor data. See ?jit_trace to learn more.

New print method for nn_modules

In this release we have also improved the nn_module printing
methods in order to make it easier to understand what’s
inside.

For example, if you create an instance of an nn_linear module
you will see:

nn_linear(10, 1)
An `nn_module` containing 11 parameters. ── Parameters ────────────────────────────────────────────────────────────────── ● weight: Float [1:1, 1:10] ● bias: Float [1:1]

You immediately see the total number of parameters in the module
as well as their names and shapes.

This also works for custom modules (possibly including
sub-modules). For example:

my_module <- nn_module( initialize = function() { self$linear <- nn_linear(10, 1) self$param <- nn_parameter(torch_randn(5,1)) self$buff <- nn_buffer(torch_randn(5)) } ) my_module()
An `nn_module` containing 16 parameters. ── Modules ───────────────────────────────────────────────────────────────────── ● linear: <nn_linear> #11 parameters ── Parameters ────────────────────────────────────────────────────────────────── ● param: Float [1:5, 1:1] ── Buffers ───────────────────────────────────────────────────────────────────── ● buff: Float [1:5]

We hope this makes it easier to understand nn_module objects. We
have also improved autocomplete support for nn_modules and we will
now show all sub-modules, parameters and buffers while you
type.

torchaudio

torchaudio
is an extension for torch developed by Athos Damiani (@athospd), providing audio
loading, transformations, common architectures for signal
processing, pre-trained weights and access to commonly used
datasets. An almost literal translation from PyTorch’s Torchaudio
library to R.

torchaudio is not yet on CRAN, but you can already try the
development version available here.

You can also visit the pkgdown website for examples
and reference documentation.

Other features and bug fixes

Thanks to community contributions we have found and fixed many
bugs in torch. We have also added new features including:

You can see the full list of changes in the NEWS.md
file.

Thanks very much for reading this blog post, and feel free to
reach out on GitHub for help or discussions!

The photo used in this post preview is by
Oleg Illarionov
on
Unsplash

Categories
Misc

Scotland’s Rural College Makes Moo-ves Against Bovine Tuberculosis with AI

Each morning millions of bleary-eyed people pour milk into their bowls of cereal or cups of coffee without a second thought as to where that beverage came from. Few will consider the processes in place to maintain the health of the animals involved in milk production and to ensure that the final product is fit Read article >

The post Scotland’s Rural College Makes Moo-ves Against Bovine Tuberculosis with AI appeared first on The Official NVIDIA Blog.

Categories
Misc

Ubuntu install help

Hi there! I am brand new to unbuntu and I have just build a
computer running it. I am currently trying to download TensorFlow
for my computer and I am trying to run the comamnd:

$. ./venv/bin/activate.fish # fish

and it’s returning this:

bash: ./venv/bin/activate.fish: line 4: syntax error near
unexpected token `-d’

bash: ./venv/bin/activate.fish: line 4: `function deactivate -d
“Exit virtualenv and return to normal shell environment”‘

Any thoughts?

submitted by /u/Elrekl

[visit reddit]

[comments]

Categories
Misc

layers with zero parameters have no weights?

When we print model.summary(), it shows the number of parameters
associated with each layer. When the number is zero, it means there
are no weights associated with this layer. Is that correct?

A very basic question but I just want to confirm. Having issues
with loading pretrained weights ‘by_name’, hence trying to
debug.

submitted by /u/juggy94

[visit reddit]

[comments]

Categories
Misc

Meet the Researcher, Rommie Amaro, Simulating the SARS-CoV-2 virus with AI and HPC

This month we spotlight Rommie Amaro, professor and endowed chair in the Department of Chemistry and Biochemistry at the University of California, San Diego.

‘Meet the Researcher’ is a new series in which we spotlight different researchers in academia who are using GPUs to accelerate their work. This month we spotlight Rommie Amaro, professor and endowed chair in the Department of Chemistry and Biochemistry at the University of California, San Diego.

Amaro is also the principal investigator of the Amaro Lab, which is broadly concerned with the development and application of state-of-the-art computational and theoretical techniques to investigate the structure, function, and dynamics of complex biological systems for applications to drug discovery.

This year, she led a team of 28 researchers at a number of different institutions, combining high performance computing (HPC) and AI to provide the clearest view to date of the coronavirus, winning a special Gordon Bell Prize in November 2020.

What are your research areas of focus?

I like to call myself a computational biophysical chemist. In general, we use computational models to explore biological and chemical systems. The idea of being able to use mathematics and computing to understand how biological systems work is just fascinating to me. Over the years, we’ve applied this to areas such as cancer and DNA editing.

What motivated you to pursue your recent research area of focus in supercomputing and the fight against COVID?

We had been working for a number of years on influenza virus, and so after 7-8 years of work on that, we published a paper in February on simulating the influenza virus envelope. That project was really a labor of love. It presented, for the first time, molecular simulations of a lipid enveloped virus in atomic detail. The size was 160 million atoms, very large, and to get to that point we had to overcome multiple technical challenges to simulating viruses in such detail.

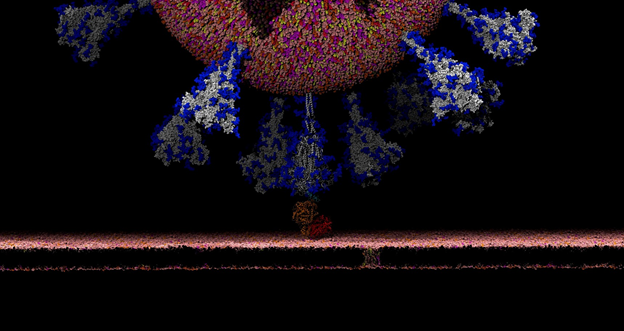
When SARS-CoV-2 hit, it was an immediate and natural pivot to focus on COVID. As soon as the McLellan group deposited the spike structure in the bioRxiv, we scooped up the data and started working with it, aiming to simulate the complete spike structure in all its atomic detail.

Simulation of SARS-CoV-2

What problems does your research address?

There’s this aspect of the virus that’s very intriguing. Viruses in general have evolved something called a glycan shield, which is basically a sugary coating that the virus uses to mask itself from the human immune system.

All of the cells in our body are coated with different types of sugar molecules, called glycans. The viruses have evolved this way of looking just like other human cells by covering themselves in the same soft of sugary coating. That way, when viruses get into our bodies, our immune system doesn’t see spike protein, it sees this sugary coating. Since it looks like any other cell, the human body doesn’t recognize it as a threat and therefore doesn’t activate the immune system response.

Experimentally, we know these glycans are there but can’t take pictures of them because the sugars move around quite a bit, one can’t get a crisp image of what they actually look like. This is where computing has a lot to give because we can basically create an atomic level structure of what those sugar molecules look like and then that gives us the picture of the sugar structures and what they’re doing. That’s what our research addresses.

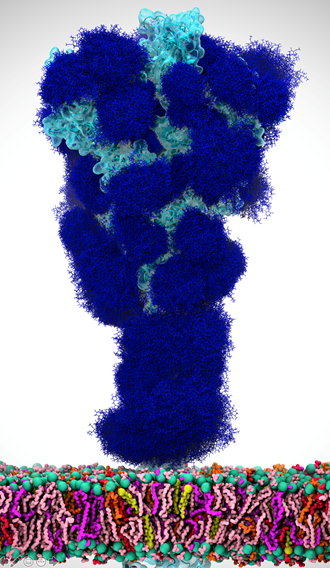
Our simulations gave people the first views of what the glycan shield looks like on the viral spike protein. For researchers, it’s not only knowing where that shield is, but it’s even more critical knowing where the shield is not because there are holes in the shield, vulnerabilities of the virus. We can use that information to understand where and how antibodies bind and how to use this information in the design of novel therapeutics.

Simulation of SARS-CoV-2 spike protein 

What is the (expected) impact of your work on the field/community/world?

The reason that we care about simulating the virus in all its atomic detail is that it helps us understand how the virus works, the mechanisms of viral infection, as well as to understand and design new therapeutics. For example, drug molecules that target different virus protein molecules or different parts of the virus. It also helps us understand how antibodies work, their design with vaccines. Having information about where all the atoms are and what they’re doing is really critical.

How have you used NVIDIA technology in your current research?

The main tool my team is using is molecular dynamics simulations. We like to think of this tool as a computational microscope. We take data from different sources, bring these data streams together to create these highly detailed, accurate models of the virus.

The simulations run on chips like NVIDIA GPU systems, and use supercomputing sites that use NVIDIA GPUs. The kind of math these simulations require ports super well to GPUs. That’s where NVIDIA technology has been transformative: it’s allowed us to speed up our calculations tremendously. It’s basically making our microscope really powerful–getting better, more accurate views of the virus much faster. The sooner we have that information, the sooner we can develop drugs and therapeutics to fight the virus.

What were some of the challenges you faced while pursuing your research?

This whole year has been extraordinary. It’s a really crazy time to be a scientist, in the sense of being on the front lines trying to understand the mysteries of COVID-19. There’s so much data coming in from all over the world. We’ve had so many sleepless nights since February/March, working around the clock.

At the same time, there’s been so many amazing collaborations. So many people around the world focused on one single problem. This doesn’t happen, typically we’re each working on different things.

What’s next for your research?

We’re just at the beginning, there’s so much we want to do. Now that we’ve got the virus built and simulated, and that was honestly an incredible feat in terms of how fast we were able to do it, the next is to build and simulate the host cell, the human cell. We want to understand how the virus latches on because it’s a pretty complex process.

Another aspect I’m really excited to study—there are a lot of questions about how and why the virus is airborne transmissible. One of the things we’re planning to do next is to build aerosol particles that have the virus inside of them. These systems will have about one billion atoms. This will help us understand what’s happening to the virus in the air and how long it lives and how it can infect people under a range of conditions, such as relative humidity.

There’s just so much to do.

Any advice for new researchers, or early career professionals, especially to those who are inspired and motivated by your work?

Find your passion. It won’t necessarily be science for everybody. We need so many kinds of people to make the world go round.

Find that thing that lights you up, that you just want to keep coming back to. When I was at university and Saturday came around, everyone would go tailgating. I looked forward to going into the lab. When you really find your passion, your work doesn’t feel like your job. And when your passion unites with the ability to serve others or a greater good, it’s so incredibly rewarding.

Also, education is super important–stay at it, stay it in, to get a better life. 

Categories
Misc

NVIDIA Rolls Out New Drivers for Vulkan Ray Tracing, Upgrades Quake II RTX

Continuing its industry-leading leading support for Vulkan Ray Tracing, NVIDIA is today rolling out production Vulkan drivers bringing Vulkan Ray Tracing support to GeForce and Quadro for both Windows (version 460.89) and Linux (version 460.27.04).
Vulkan is the industry’s first open, cross-vendor standard ray tracing API, enabling portable ray tracing acceleration across diverse platforms.

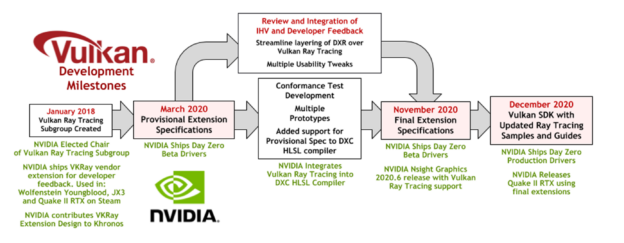
In November 2020, The Khronos Group released the final versions of the Vulkan Ray Tracing extension specifications that seamlessly integrate ray tracing into the existing Vulkan framework so that developers can reach more platforms and customers with less development and porting costs. Today, Khronos released an upgraded version of the Vulkan SDK with full Vulkan Ray Tracing support, enabling Vulkan developers to easily integrate ray tracing functionality into their applications for the first time.

Continuing its industry-leading support for Vulkan Ray Tracing, NVIDIA is today rolling out production Vulkan drivers bringing Vulkan Ray Tracing support to GeForce and Quadro for both Windows (version 460.89) and Linux (version 460.27.04).  All RTX GPUs are supported, together with GeForce GTX 1660 with 6GB+ of memory and GeForce GTX 1060+ with 6GB+ of memory. Together with the support for Vulkan Ray tracing in the NVIDIA Nsight Systems 2020.5 and  Nsight Graphics 2020.6 developer tools, all developers are now enabled to integrate portable ray tracing into software ranging from real-time games to professional applications.
NVIDIA Contributions to the Development of Vulkan Ray Tracing

Bringing ray tracing functionality into the Vulkan standard has been a multi-year effort by many companies and NVIDIA has taken an active leadership position in each stage of its evolution. We were elected to chair the Vulkan Ray Tracing subgroup at Khronos, we contributed the design of our VKRay vendor extension to Khronos to help the Vulkan working group make rapid progress, and we shipped beta drivers for the provisional version of the Vulkan Ray Tracing extensions to enable developer feedback. 

NVIDIA has also implemented Vulkan Ray Tracing support in Microsoft’s open source DXC HLSL compiler. As outlined earlier this year, production-ready use of HLSL in Vulkan has been achieved through integrating a SPIR-V backend into DXC. Now, NVIDIA has extended that SPIR-V support to include Vukan Ray Tracing functionality, enabling developers to use HLSL shaders in Vulkan Ray Tracing applications instead of GLSL if they prefer. This also makes porting DirectX 12 ray tracing (DXR) functionality to Vulkan far easier to enable applications on a far wider diversity of platforms.

Vulkan is used extensively as a backend for layered implementations of APIs such as DirectX 12 to enable Windows games on platforms such as Linux. Vulkan Ray Tracing has been carefully designed to support the efficient layering of DirectX 12 ray tracing to enable tools such as Valve’s vkd3d-Proton to support the execution of applications that use DXR on Linux. NVIDIA is actively contributing to the development of translation tools such as Wine, whose upcoming 6.0 release supports Vulkan specification version 1.2.162 which includes Vulkan Ray Tracing.

Vulkan Ray Tracing extensions being used in Quake II RTX

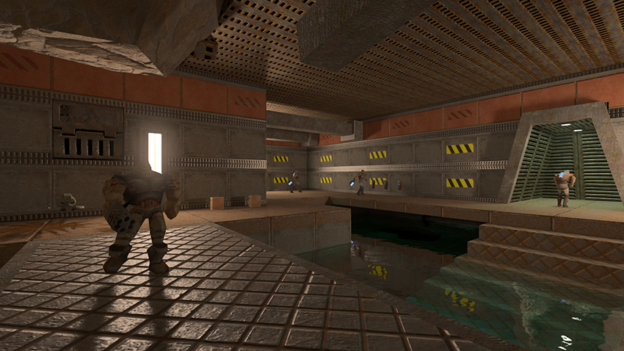
In 2019, NVIDIA worked to bring ray tracing to Quake II. The Quake II RTX demo significantly enhances the visual quality of this well-loved classic running on Vulkan with ray-traced lighting, shadows, and reflections. NVIDIA released the full source code on GitHub serving as a great example for developers who want to dive into the details of how this remastering was achieved. Today, with the release of Quake II RTX 1.4.0, NVIDIA has added support for the final Vulkan Ray Tracing extensions, enabling dynamic selection between the pre-existing NVIDIA VKRay and the new Khronos extension backends. This means the game can now run on GPUs from any vendors that support the `VK_KHR_ray_tracing_pipeline` extension, making Quake II RTX the world’s first cross-vendor ray tracing Vulkan game!

To learn more about Vulkan Ray Tracing and how you can use it in your own applications check out Khronos-hosted resources including: how to use the Vulkan Ray Tracing extensions, a deeper dive into the technical details of the final Vulkan Ray Tracing specifications and best practices for blending Vulkan rasterization and ray tracing techniques. The Khronos Group is actively monitoring developer feedback on the Vulkan Ray Tracing extension through the Vulkan issues tracker on GitHub.

A glTF model with NVIDIA’s sample open source ray tracing viewer

NVIDIA has also created a deep dive Vulkan Ray Tracing Tutorial, and a new tutorial that steps through how to create a complete mini-path tracer using the Vulkan Ray Tracing API, and a Vulkan-based glTF ray tracing viewer with open source on GitHub. Keep up to date with NVIDIA’s ongoing support for Vulkan on the NVIDIA Vulkan Developer Page.

Vulkan Ray Tracing is a critical step to making ray tracing pervasive across the computer graphics ecosystem, and it is now easily accessible to developers everywhere.

We can’t wait to see how you use it!